ER Diagrams
An entity-relationship model describes interralated items of interest in a specific domain. A basic ER model is composed of entity types and specifies relationships between those entities. In software engineering, the ER model can be used to describe for example business models, but also data models or software structures.
ER models are not part of the UML standard, but are still quite often used. They are used for example conceptualizing a software, before actually implementing said software. According to their name, the ER diagrams DO NOT describe the inner functions of entities, but merely the relations between them.
Let us use one of our previous class diagrams as an example, and change that into an ER diagram.

Starting off small, let us have the class “Person” as an ER diagram.

In our diagram, we have an Entity called Person, described with a rectungular shape. The Entity has two Attributes, described with elliptical shapes. The entity name, as well as the attributes, are written as singular nouns.
For a more complex example, let’s use


In our diagram, the relationship between entities is in the middle, marked with a diamond shape. Now we can see, that our “author” has changed to “writes”. The relationship between the two is still the same, but in ER, the relationships are written as verbs. This example is now read from left to right, as in “Person writes a book”. The relation can also be drawn other way around, but let’s keep this simple.
Just like in class diagrams, ER diagrams can also used to describe cardinalities. Let’s take our Book and Person, but now with more than one relationship:
public class Book
{
  private string name;
  private string publisher;
  private List<Person> authors;

  // constructor would be here


  public List<Person> GetAuthors()
  {
      return this.authors;
  }

  public void AddAuthor(Person author)
  {
    this.authors.Add(author);
  }
}
As our book now has 0..N (zero or more) authors, we want to indicate this in our ER, as well. To do this, there are multiple different notations. We are now using Crow’s foot notation:

Now in our diagram, “many persons write one book”. It is noticeable, that in the crow’s foot notation, the relationship diamond is not compulsory, but for example the tool we use, does it automatically. As ER is not as standardized as for example UML, mixing notations is more easily forgiven.
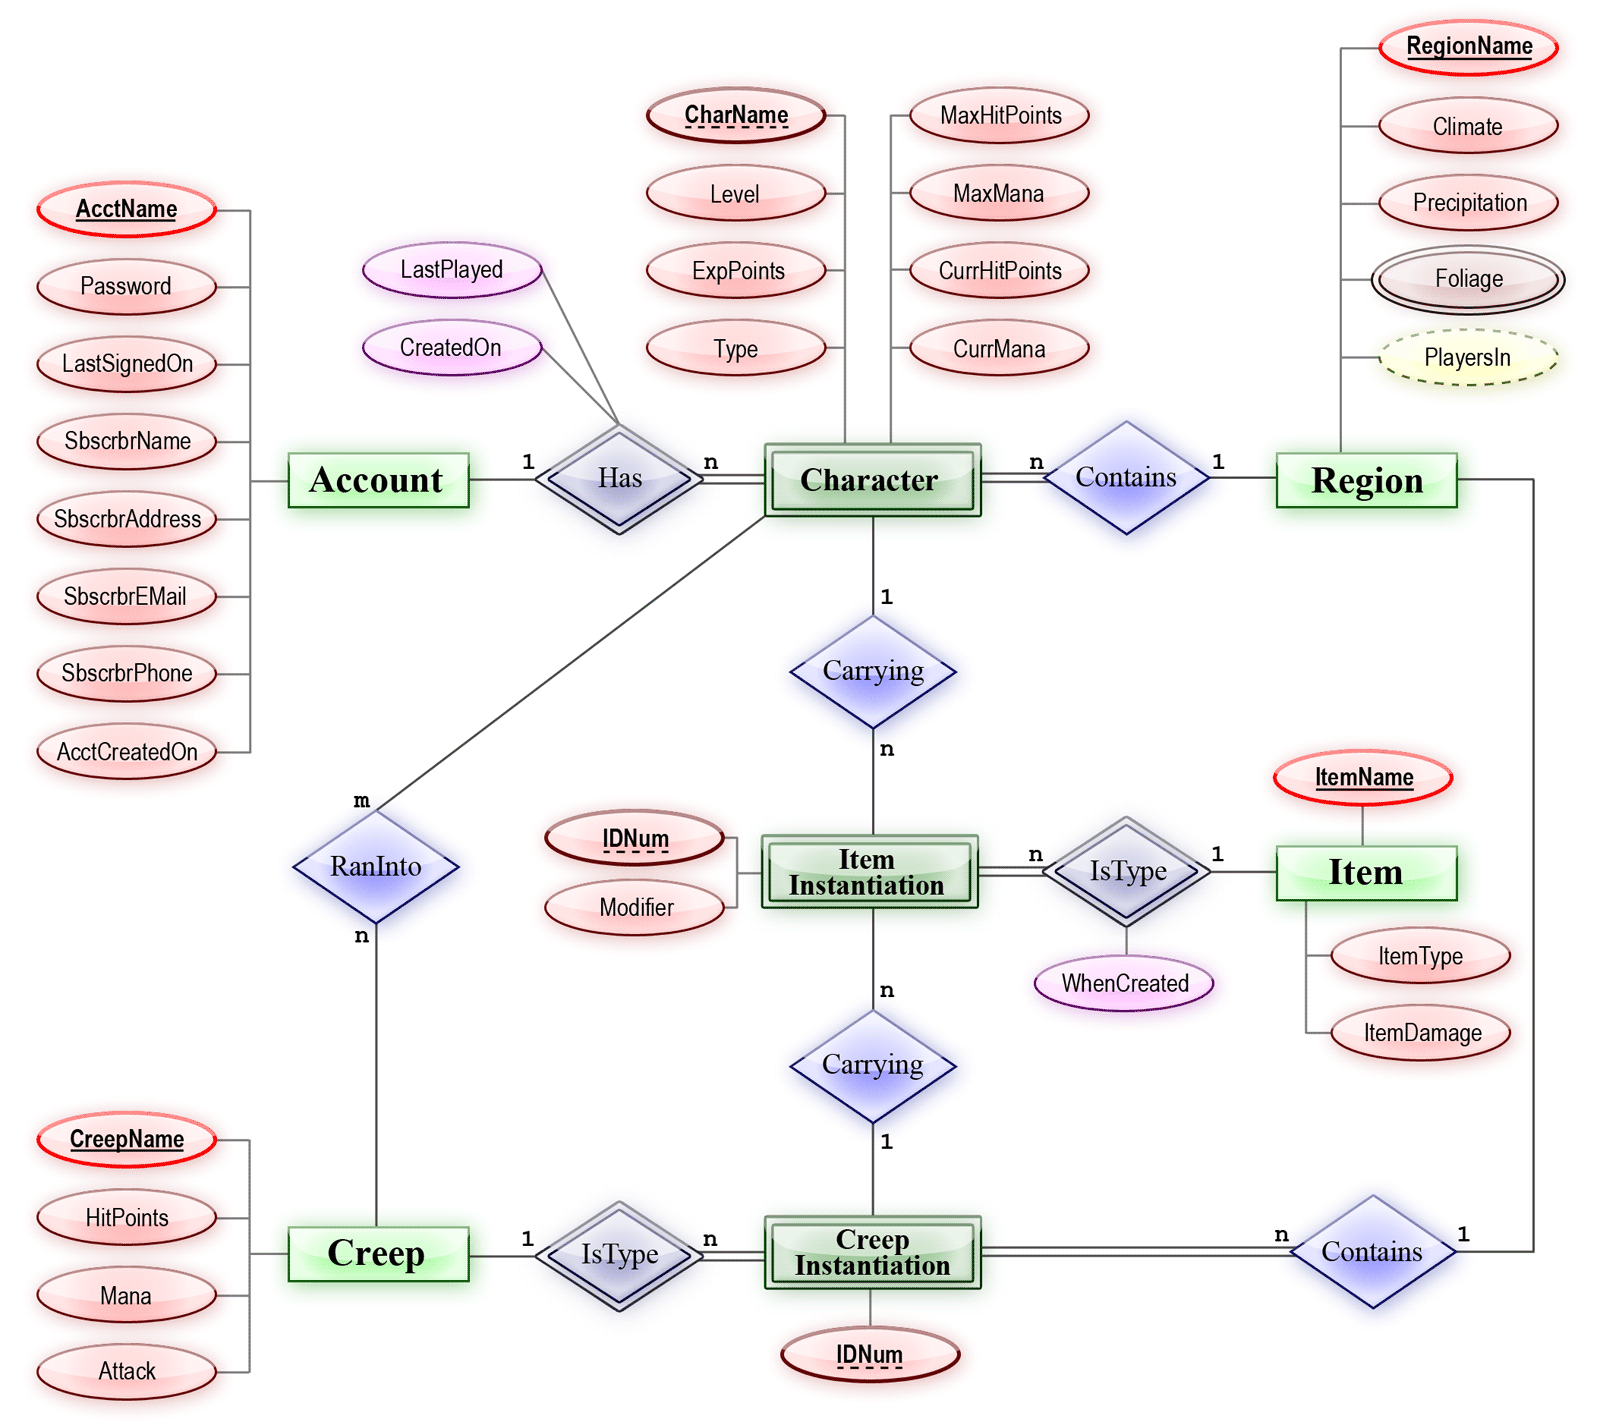
With ER charts, we can create quite complex, yet understandable diagrams. For example, here is an ER diagram, depicting a MMORPG:
 Source and license information for the picture: https://commons.wikimedia.org/wiki/File:ER_Diagram_MMORPG.png
In the diagram, we notice some notation we have not yet used. Let’s take a quick look of them
-
Underscore means it is a unique attribute, e.g. no two entities have the same value for said attribute. In the example, AcctName of entity Account is unique.
-
The relationship between Account and Character, Has, has double outer lines. This means it is an identifying relationship.
-
The entity Character has similar double lines, meaning now it is a weak entity. This means, that it cannot be identified by its attributes alone, e.g. two characters could be 100% identical.
-
Now, as the Character is weak, the attribute CharName is underlined with a dotted line, but is still the most identifying feature of said entity.
-
In the entity Region, we have one more type of notation, a dotted outer line, with attribute PlayersIn. This means derived attribute. For example, the entity Region does not have the attribute as such, but could be derived from the locations of the players’ characters.
As you can see, ER diagrams are quite the versatile tool for describing information, but require some background knowledge, how the diagrams work.
It is also notable, that ER diagrams are not designed for describing classes and their functionality, but rather the bigger picture, or databases. We will, how ever, break this rule this time, and rehearse using them with some classes in our exercises.
Sequence Diagrams
Now we know how we can describe our software’s structure. But what does the software actually do, and how? Let’s take a look. For this, we need a program which actually does something. Luckily, we have used some in our Basics in Programming course. Let’s bring a Person class and a Main here now:
public class Person
{
  private string name;
  private int age;

  public Person(string initialName) {
    this.age = 0;
    this.name =  initialName;
  }

  public void PrintPerson() {
    Console.WriteLine(this.name + ", age " + this.age + " years");
  }
}
class Program
{
  static void Main(string[] args)
  {
    Person ada = new Person("Ada");
    Person antti = new Person("Antti");

    ada.PrintPerson();
    antti.PrintPerson();
  }
}
In our Person class, we have a constructor with a single parameter, as well as a method PrintPerson. In our Program class, we create two persons, and call their PrintPerson methods. Let’s put that into a sequence diagram:

(This diagram was made with Draw.io.)
In our diagram we see the Main calls for the object Ada with the line new Person(“Ada”);.
-
As the arrow is pointing to the Actor’s name, we know it is a creation command. Indicating creation is not always necessary in Sequence diagrams, but if you want to emphasize the creation, this is the notation for it.
-
The next arrow does the same, but this time for our Actor Antti.
-
Next we call the Actor Ada, with the method PrintPerson(). Notice, that since it is that object’s method, we do not add the object name in front of the command.
-
The block which begins from the arrow, is called lifeline. This indicates a timeline inside the object, from which we return to the calling actor.
-
In the lifeline, we have a self message. This means that something is being processed in the class itself. This time, it is our method with void as a return value, i.e. the call from the main triggers the method to do something.
-
After the self message is over, we use a dotted line to return to the main.
-
We repeat this process with the other actor, as well.
Sequence diagrams can be used to clarify, what happens between classes and objects, where do the calls go, and what do they trigger. Let’s take a look of a different example:
public static void Main(string[] args)
  {
    ReadNumber();
  }

public static int ReadNumber()
{
  while (true)
  {
    Console.Write("Give a number: ");
    try
    {
      int readNumber = Convert.ToInt32(Console.ReadLine());
      return readNumber;
    }
    catch (Exception e)
    {
      Console.WriteLine(e.Message);
    }
  }
}
Now we have a Main method, and ReadNumber method. Technically, this could all be done as self messages as they are both part of the same Project class, but for clarity’s sake, let’s handle them as separate actors.

This diagram was created with https://sequencediagram.org/.
In this diagram…
- Our Main calls the ReadNumber with the first arrow.
- The lifeline of ReadNumber is activated.
- We begin our loop, and the condition is while(true)
- In the loop, we call the Console.ReadLine. You could make the Console an actor of its own, but having common print actions as self messages is quite fine for our detail level.
- Next down, we have a note, telling what happens in the code. As all the code is not reasonable to sequence out, we can use notes to simplify the diagram, yet give more information.
- Next we have our break condition. As the loop breaks if readNumber is an integer, we give that information in the diagram.
- Now we return the value of our variable readNumber to our main, just like our method returns it.
- With the return, we deactivate the lifeline for ReadNumber.
Sequence diagrams are an easy and fast way to make yourself comprehend, what actually happens inside your code. They are not the only way to describe these events, but more on that later.
Tools of the trade
The diagrams in this page were done with the following tools:
-
https://erdplus.com/standalone was used for the ER diagrams. The tool gives ready made buttons from which to select entities, and they are easy to modify within the tool itself.
-
Draw.io is a all-around drawing tool, where you can create multiple different kinds of diagrams. It might take a while to learn how to get everything point in the correct direction, but once mastered, an uncanny tool for documentation.
-
https://sequencediagram.org/, an easy but versatile tool for creating sequence diagrams. You can create diagrams by code or through the graphical user interface. Notice, that this tool does not, how ever, have all the available options, such as creation arrows.
-
If you are already more familiar with other tools, of prefer for example LucidChart, you are more than welcome to use your tools of choice.
You can find the exercises here